We Gained Speed And Lost Intention
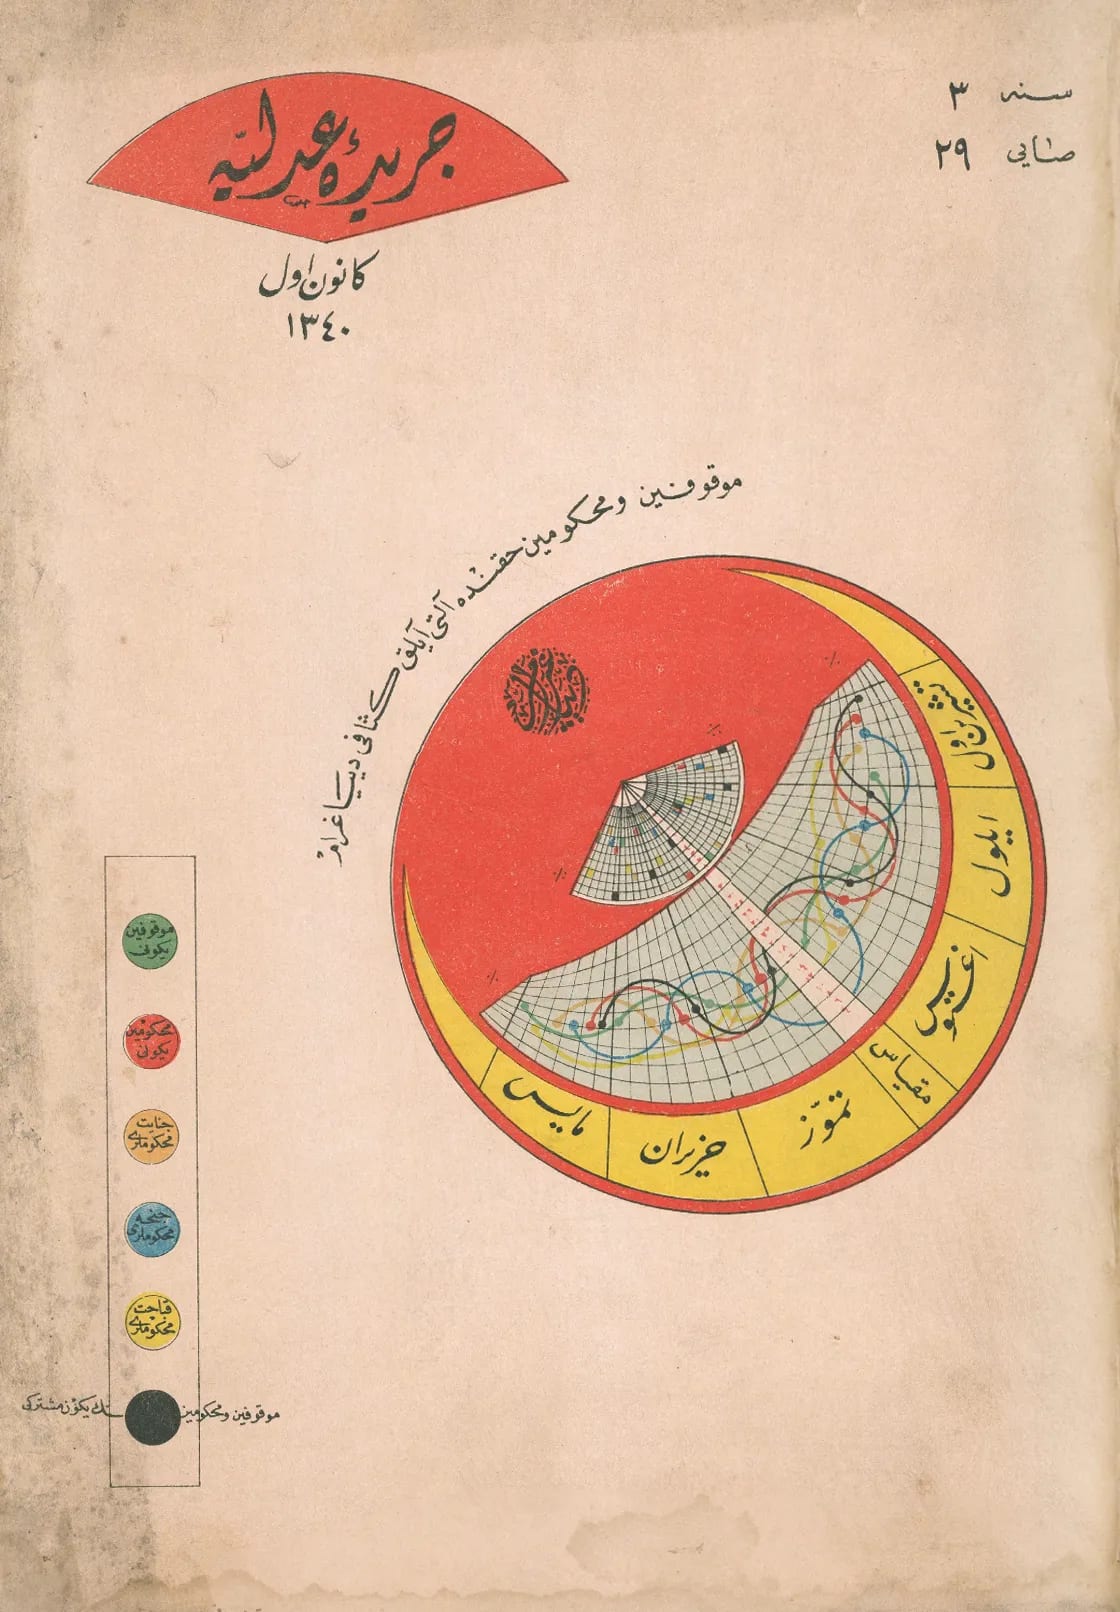
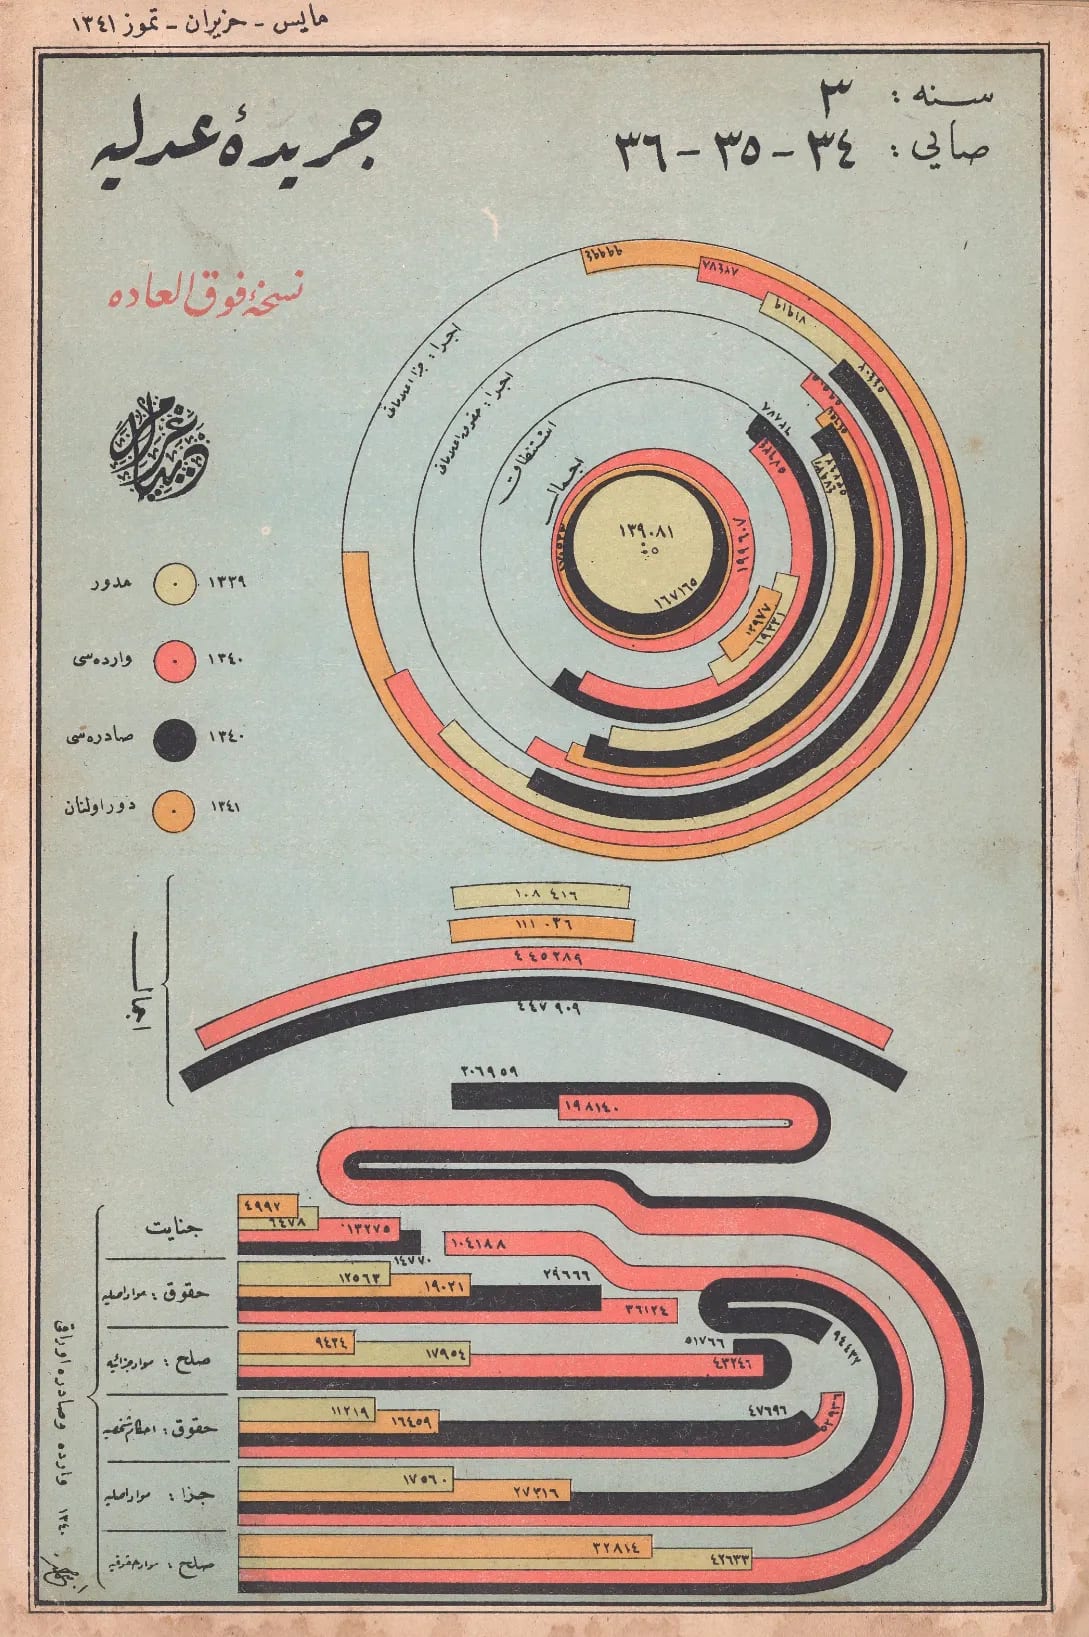
Someone in 1924 drew these by hand.
A statistician at the Ottoman Ministry of Justice looked at dry judicial data and asked one question:
What shape is this truth?
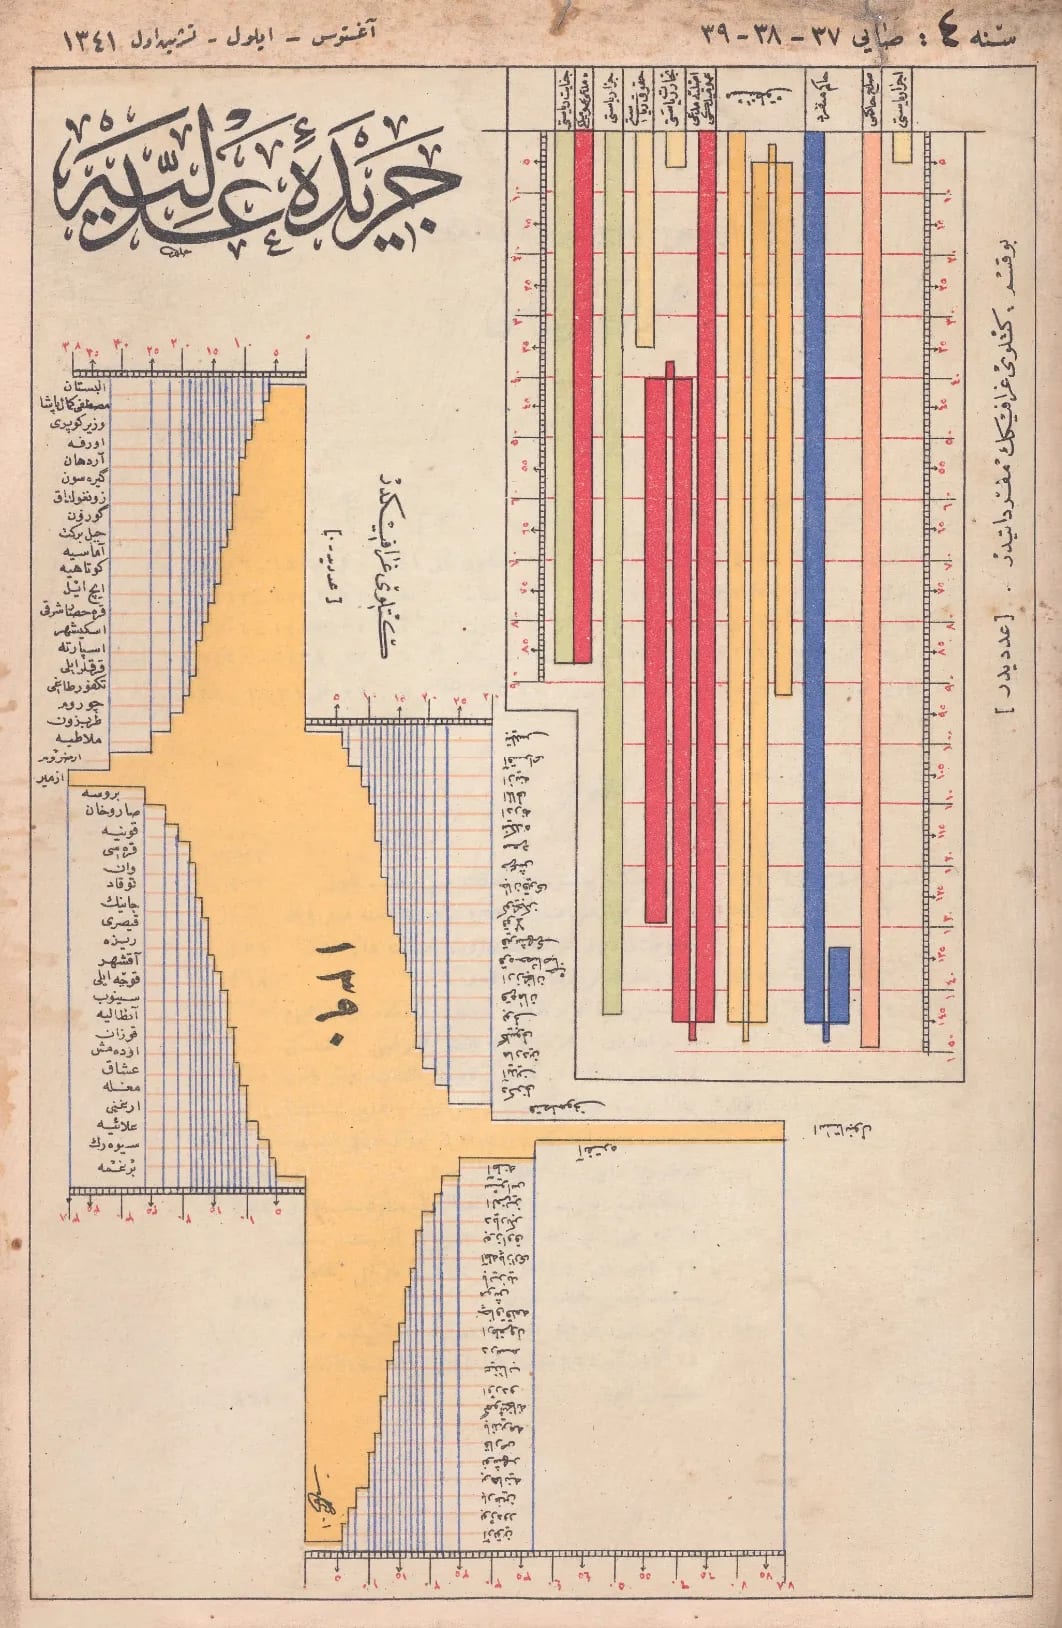
This is two years of criminal cases flowing through the Ottoman Empire’s justice system. It moves like a river because the data is a river. They could have drawn a straight bar. They chose a river.
The form is the argument. The beauty is the persuasion.
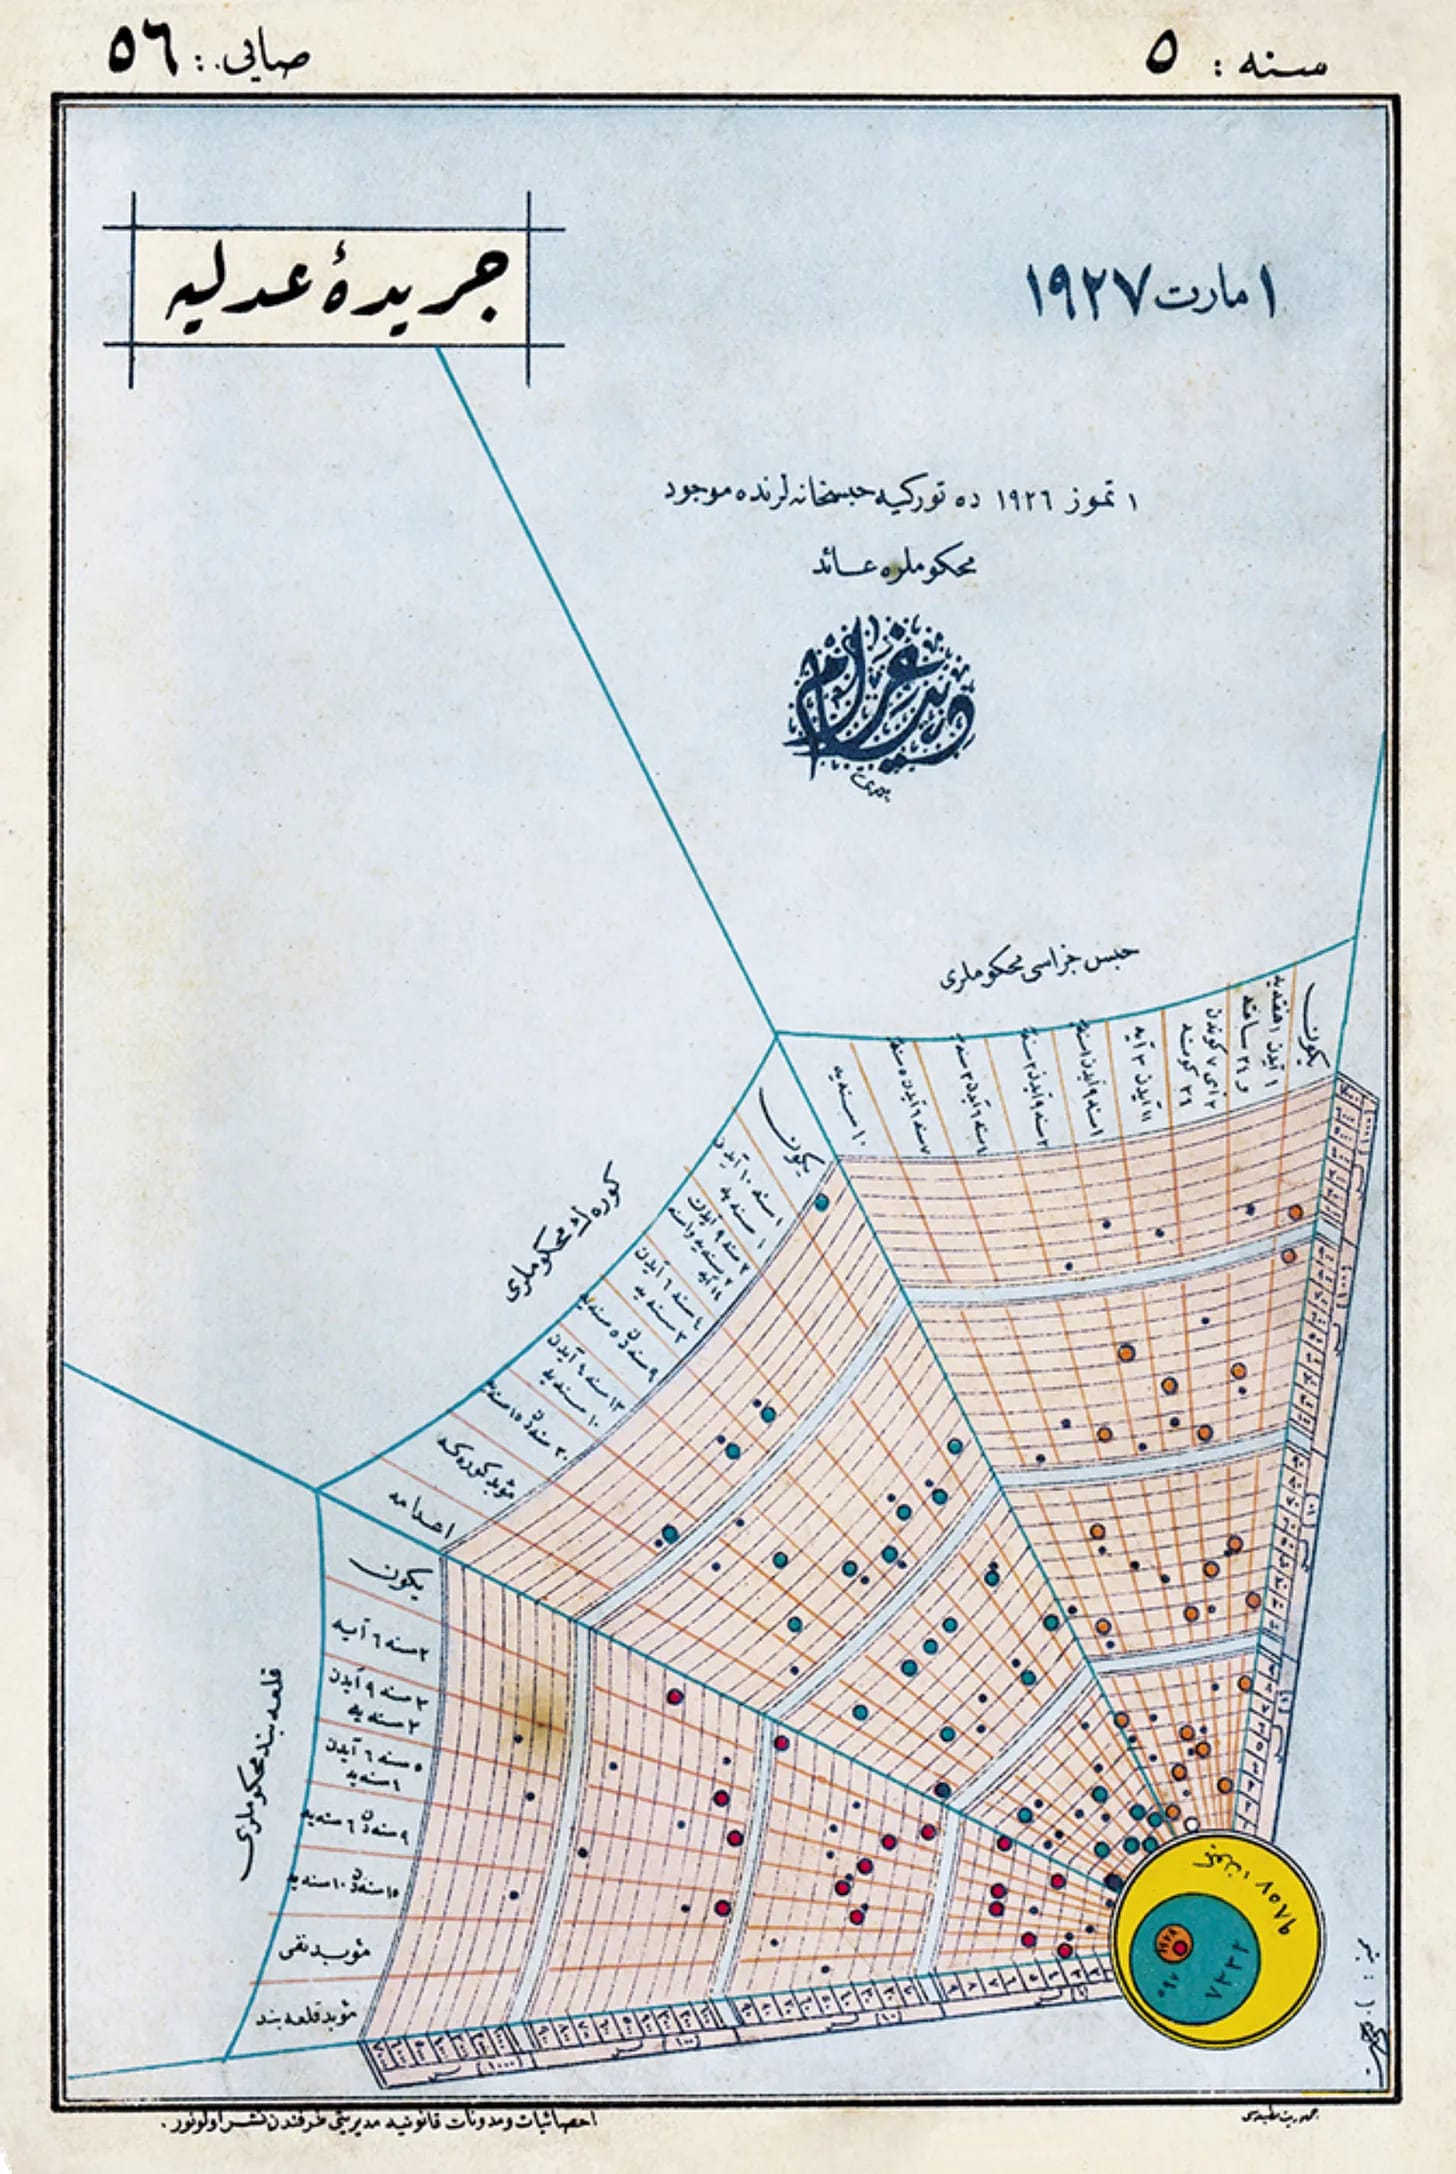
Every bar is a different city. Every city has a different relationship with crime and punishment. Your eye travels naturally, compares automatically, and lands on outliers without being told where to look. An entire country is quite readable at a glance.
Now open any business dashboard.
Bar charts. Donut charts. Line graphs with 11 series and a legend nobody reads. Tables pretending to be insights. It’s boring.
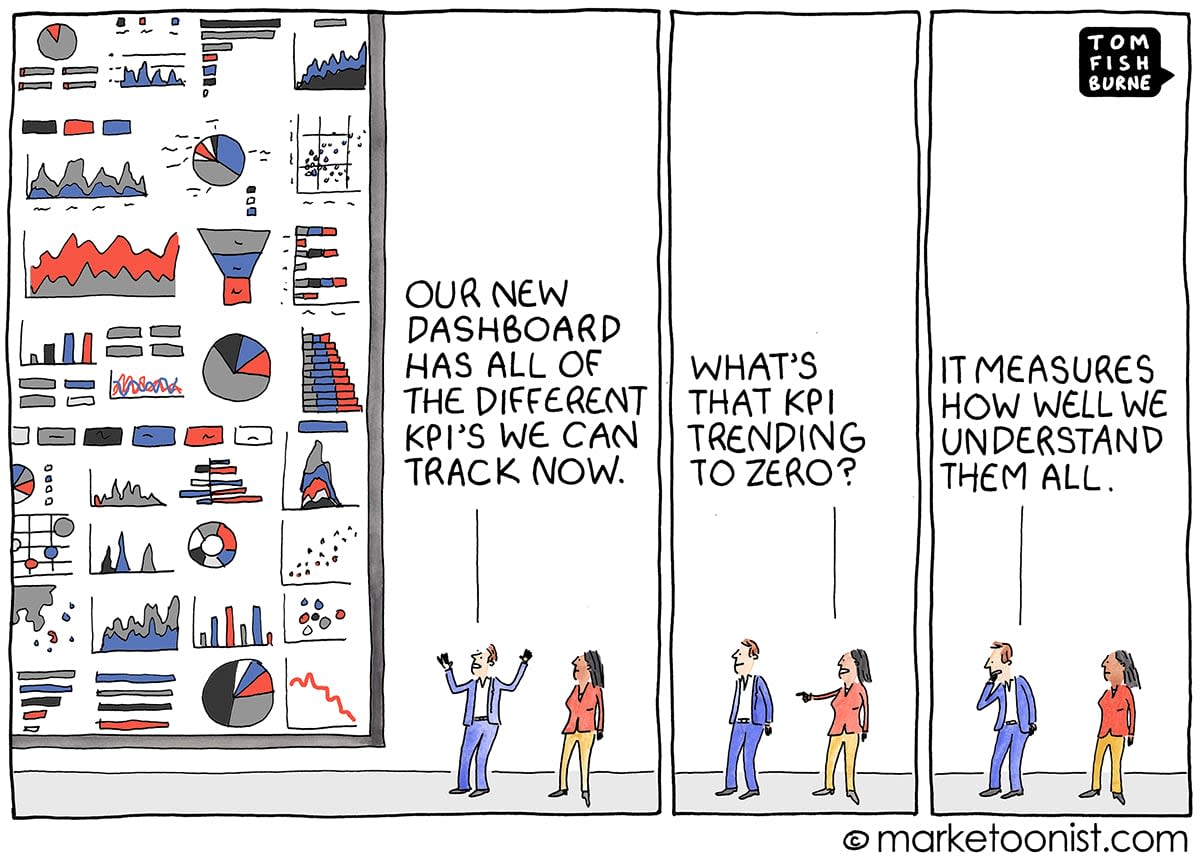
I believe two things killed us.
Templates and speed
The tool suggests a bar chart, and we click accept. Every dashboard looks the same because everyone outsourced the thinking to the same software. Same weird blue bar charts or the same type of pie charts. Everywhere.
Speed did the rest. A bar chart takes 10 minutes. We optimize for defensible: if the chart survives the meeting, it’s a win. Nobody really cares what the chart is explaining.
On the other hand, look at these ones:
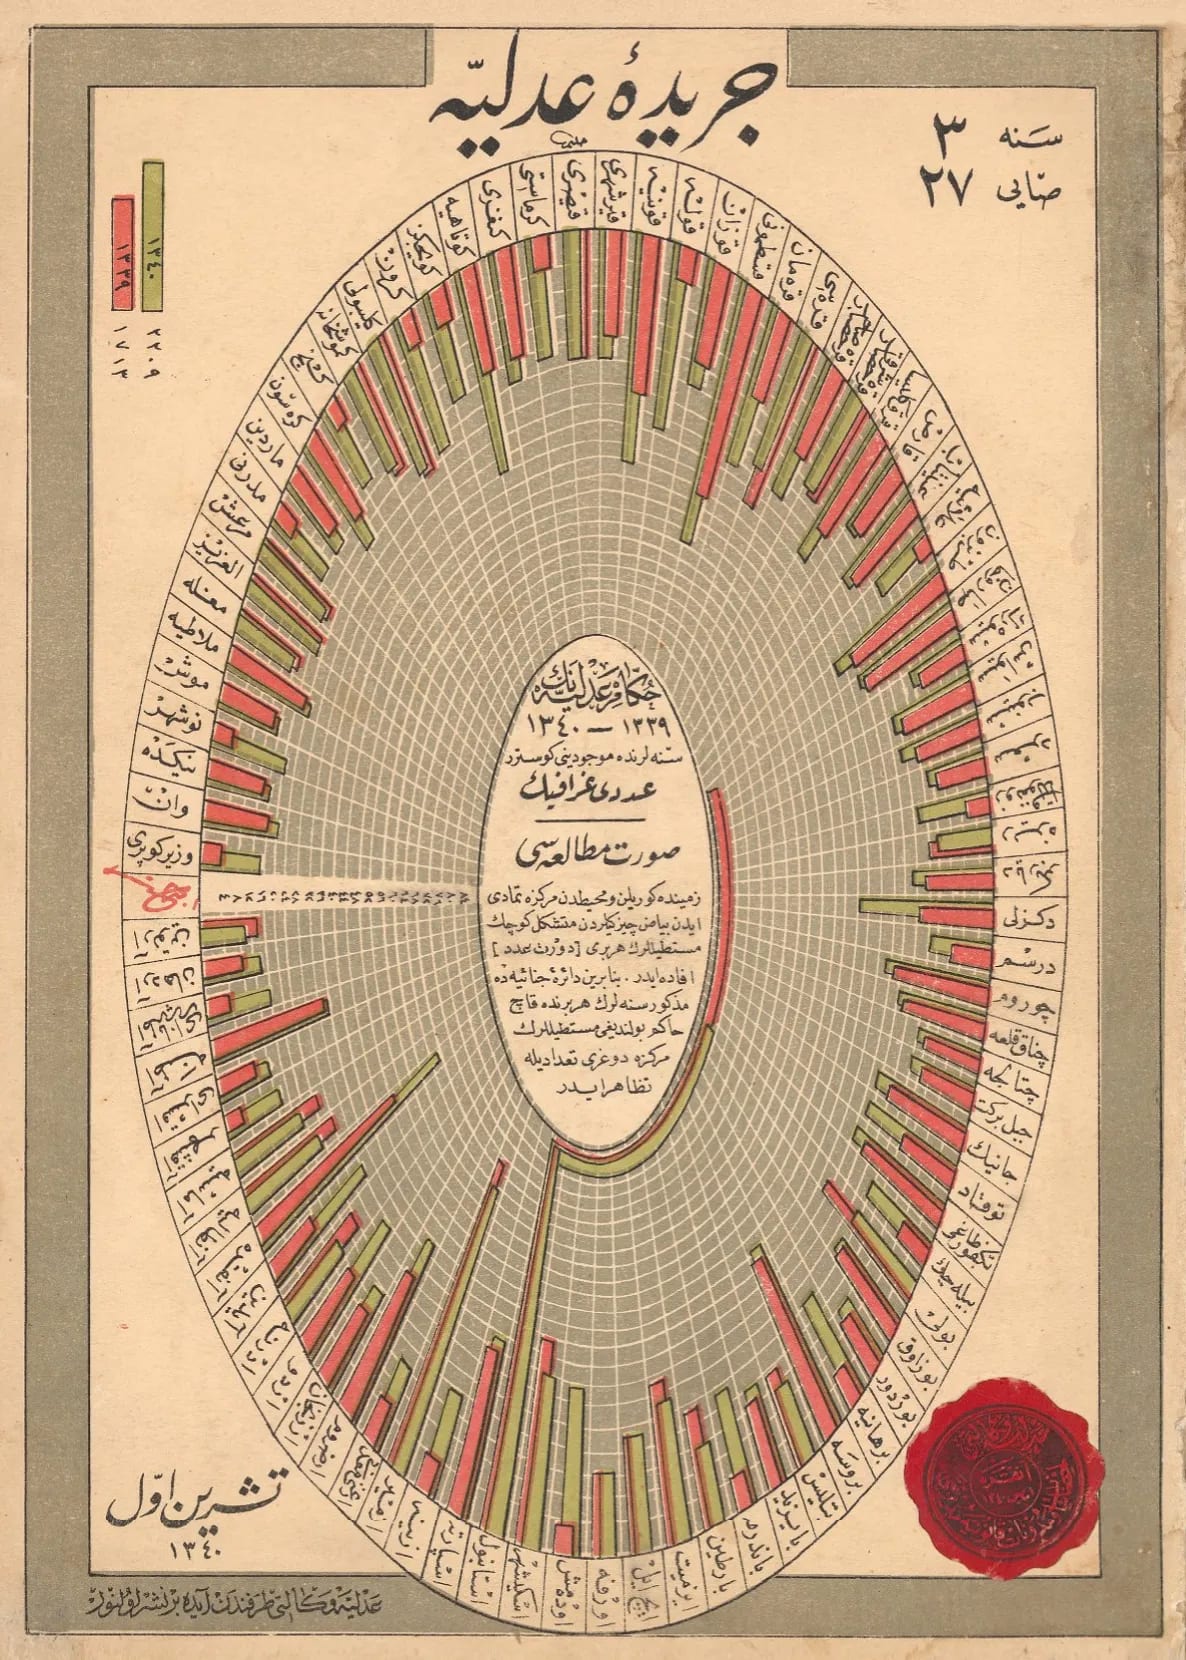
Sixty cities ranked by judicial caseload. The whole country on one page. I cannot imagine right now someone trying to fit this type of statistic into a page.
The emotional experience of information is information.
Next time, creating a dashboard
We should be asking ourselves: “How can I really give the emotional experience of this information?”
Source: “Poetic Justice” by Elizabeth Goodspeed. Original charts from Ceride-i Adliye, Ottoman Ministry of Justice Statistical Gazette, 1920s. Check out the other graphs too.